

7 practical ways to monitor your revenue-critical flows
1. Identify and prioritize your critical user flows
Good monitoring starts with knowing exactly what to watch. Start by mapping your most important user journeys based on business impact and real traffic data.
How to do it:
- Analyze your traffic: use Google Analytics or your preferred analytics tool to find your highest-traffic pages and key conversion paths.
- List high-value flows: focus on journeys with the biggest revenue or retention impact — e-commerce checkouts, SaaS onboarding, lead gen forms, account recovery.
- Align with stakeholders: loop in product, marketing, and support to rank flows by business risk and how often they’ve caused problems in the past.
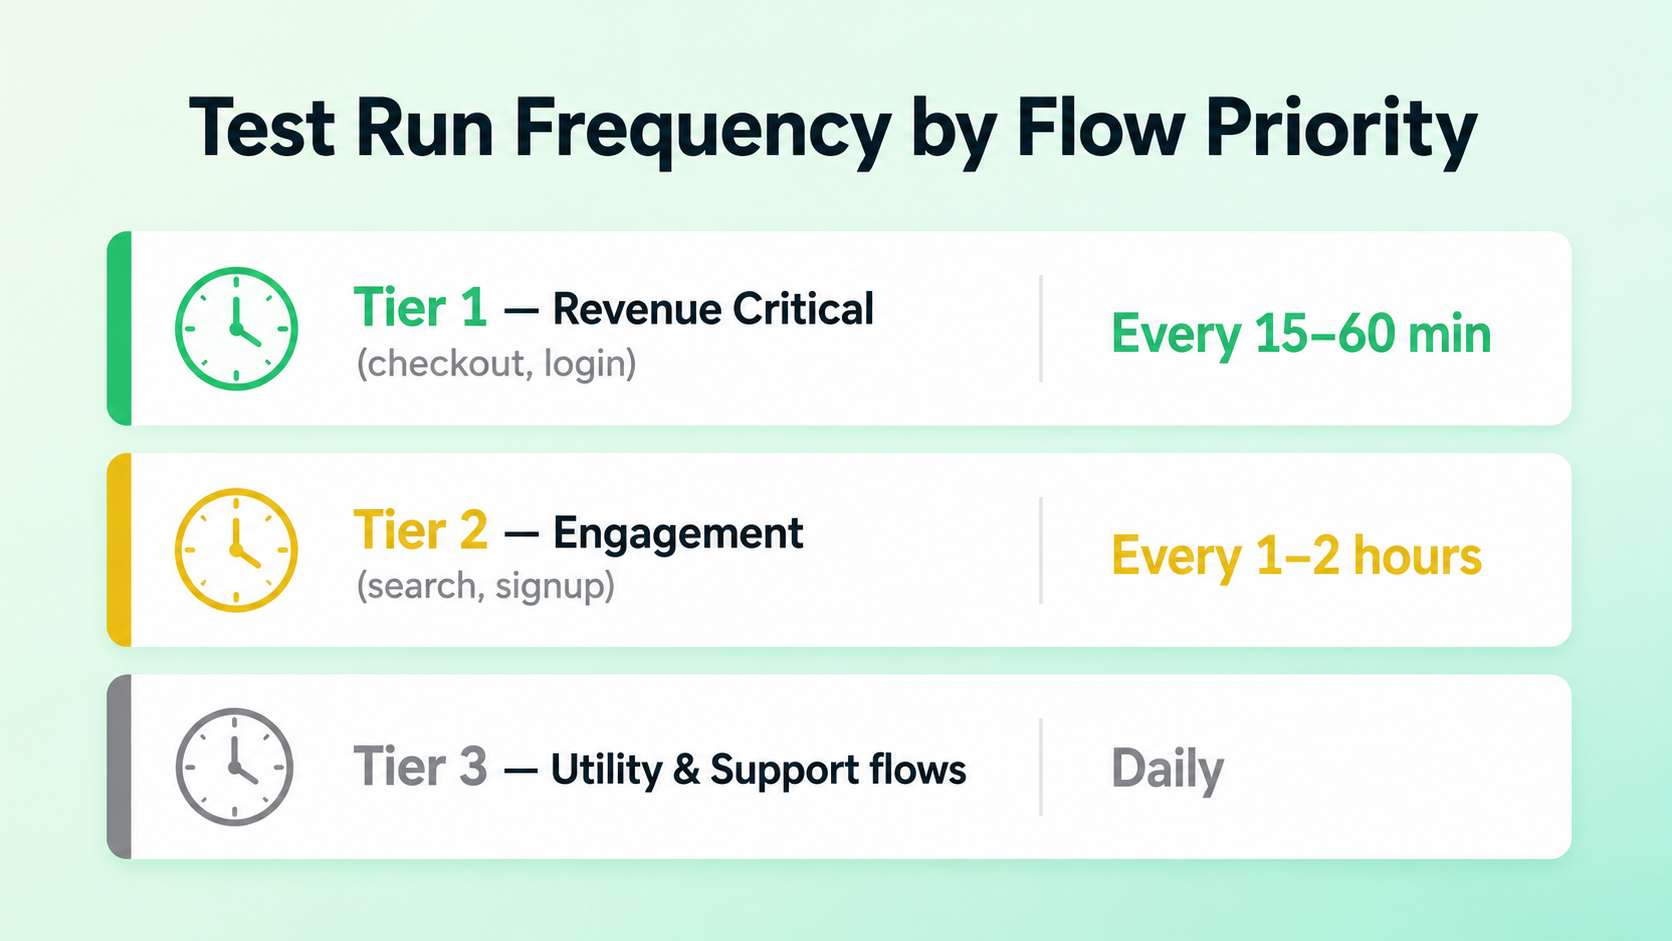
- Create a tiered list: group your tests into Tier 1 (revenue-critical, like checkout), Tier 2 (engagement, like search), and Tier 3 (utility or support flows).
Best practices for prioritization:
- Focus on the full picture: monitor complete end-to-end journeys, not just individual pages in isolation.
- Document expected outcomes: define what “success” looks like at each step (e.g., “The user sees a green success message after form submission”).
- Revisit quarterly: your site changes, so your priority list should too — treat it as a living document.
Once you’ve got your list, these flows become the backbone of your monitoring suite. Most teams find that covering just 5–7 core flows gets you 80% of the user value and risk coverage you need.
From there, use the Ghost Inspector browser extension to record those journeys and turn them into reusable, automated tests in minutes.
2. Implement synthetic browser testing for end-to-end flows
Synthetic testing uses scripted or recorded interactions to simulate real users navigating your site — starting fresh from a clean browser session every time.
Why it works for critical flows:
- Executes exact user steps: it navigates pages, fills out forms, clicks buttons, and verifies the results — exactly as a real user would.
- Proactive, not reactive: unlike real user monitoring (RUM), which waits for users to run into bugs, synthetic testing is consistent and catches issues before your customers ever see them.
How to implement it:
- Record the flow: walk through your prioritized journey in a real browser.
- Add assertions: check that specific text appears, key elements are visible, and redirects happen where they should.
- Include visual checks: automatically catch unexpected CSS changes or layout breaks before they go live.
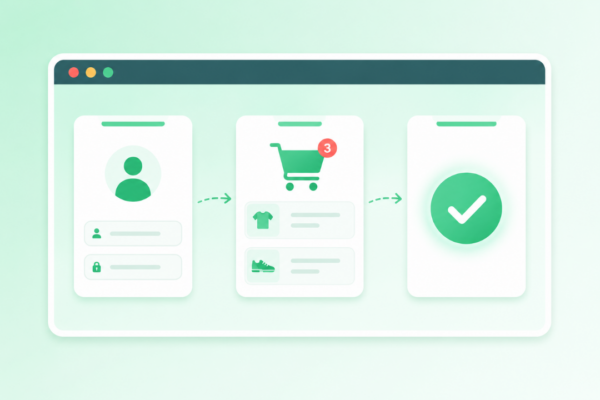
This is where Ghost Inspector really shines. Just install the free browser extension, click through your critical flow (like adding an item to a cart and checking out), and every action gets captured automatically. Then use the editor to drag and drop steps, add conditions, or plug in variables for dynamic data like test email addresses.
Run them on demand or plug them directly into your workflow — either way, you’ve got reliable, repeatable coverage for the paths that matter most.
3. Schedule automated tests for continuous 24/7 monitoring
Running a test once isn’t enough. Your critical flows can break at any time — from a new deployment, a third-party API change, an unexpected traffic spike, or a caching issue. You need eyes on them constantly.
How to set up scheduled monitoring:
- Define your run frequency: for high-risk flows, run every 15–60 minutes. For less critical paths, hourly or daily is fine.
- Choose execution locations: got a global audience? Run from multiple geographic regions to catch location-specific issues.
- Set up time-based scheduling: align runs with peak business hours so you’ve got maximum coverage when traffic is highest.
Ghost Inspector makes scheduling effortless. Once your test is set up, pick your interval or schedule specific days and times right in the platform. Tests run from the cloud on real browsers — consistent, reliable results every time.
This turns your monitoring into a proactive safety net. Teams regularly catch broken checkout flows within minutes of a bad deployment — before customers ever notice.
4. Incorporate visual regression testing into your monitoring
Functional checks tell you a feature works. But visual regression testing tells you whether your site actually looks right — and that matters just as much for user trust and brand consistency.
Why add visual checks to your monitoring:
- Detect UI bugs: catch broken layouts, overlapping elements, missing images, and styling regressions before users run into them.
- Identify hidden issues: spot layout breaks that functional assertions alone would miss — especially across different screen sizes and responsive designs.
How to implement it:
- Capture a baseline: grab baseline screenshots during your first successful test runs.
- Automate comparisons: every time a test runs, new screenshots are automatically compared against your baseline.
- Review the results: any differences get flagged in a side-by-side view so you can spot issues at a glance.
Ghost Inspector builds visual regression testing right into every test. Screenshots are captured automatically, compared against your approved baselines, and included in any failure reports. It’s especially valuable for flows where how something looks directly impacts conversions — think product pages or checkout screens.
Pair visual monitoring with functional assertions, and you’ve got comprehensive coverage — protecting both how your app works and how it looks.
5. Configure instant alerts and notifications
Monitoring your flows only matters if your team actually knows when something breaks. Without the right alerts, failing tests disappear into the noise — and that means extended downtime and lost revenue.
How to implement an effective alerting strategy:
- Prevent alert fatigue: only send notifications for confirmed failures. Use test retry logic to filter out temporary network blips and cut down on false positives.
- Route to the right channels: general updates go to Slack or Microsoft Teams, but critical off-hours failures should go straight to PagerDuty for whoever’s on call.
- Demand rich context: every alert should include the failure reason, console logs, and visual evidence. Your devs shouldn’t have to guess what went wrong or struggle to reproduce it.
- Start small and scale: start by alerting on your Tier 1 flows (checkout, login) and expand as your team builds confidence in the signal.
Ghost Inspector plugs right into your existing workflows — instant notifications via Slack, Microsoft Teams, PagerDuty, email, and Webhooks.
And every Ghost Inspector alert comes with a full video recording and a side-by-side screenshot showing exactly where things went wrong. Whether a checkout button vanished or a JavaScript error took down the page, that context makes troubleshooting fast — so your team can fix it and move on.
6. Leverage reusable modules and data-driven testing for scalability
As your app grows and you add more flows to monitor, test maintenance can become a real headache. If your login page changes and you’ve got it duplicated across dozens of tests, you’re going to have a bad time. Reusable modules and data-driven testing solve that.
How to scale your monitoring effortlessly:
- Create reusable modules: pull common, repeated steps into centralized modules you can drop into any test.
- Add data-driven testing: use variables and datasets to run multiple scenarios from a single test. Run the same checkout flow with five different payment methods, for example, without building five separate tests.
- Parameterize edge cases: use dynamic data to cover edge cases without duplicating your work.
Ghost Inspector supports all of this natively. Build a “Login Module” once and drop it into any test that needs authentication. Update the module when your login changes, and every test that uses it updates automatically.
You can also pull in spreadsheet data or use built-in variables to build dynamic, robust scenarios. The result: you can cover dozens of variations of your key flows while keeping your test suite clean and easy to manage — even as your team grows.
7. Integrate monitoring into your CI/CD pipeline and team workflows
Monitoring shouldn’t live in a QA silo. To shift quality left, you need to embed automated user flow tests directly into your release process — so bugs get caught before they ever reach production.
Best practices for team integration:
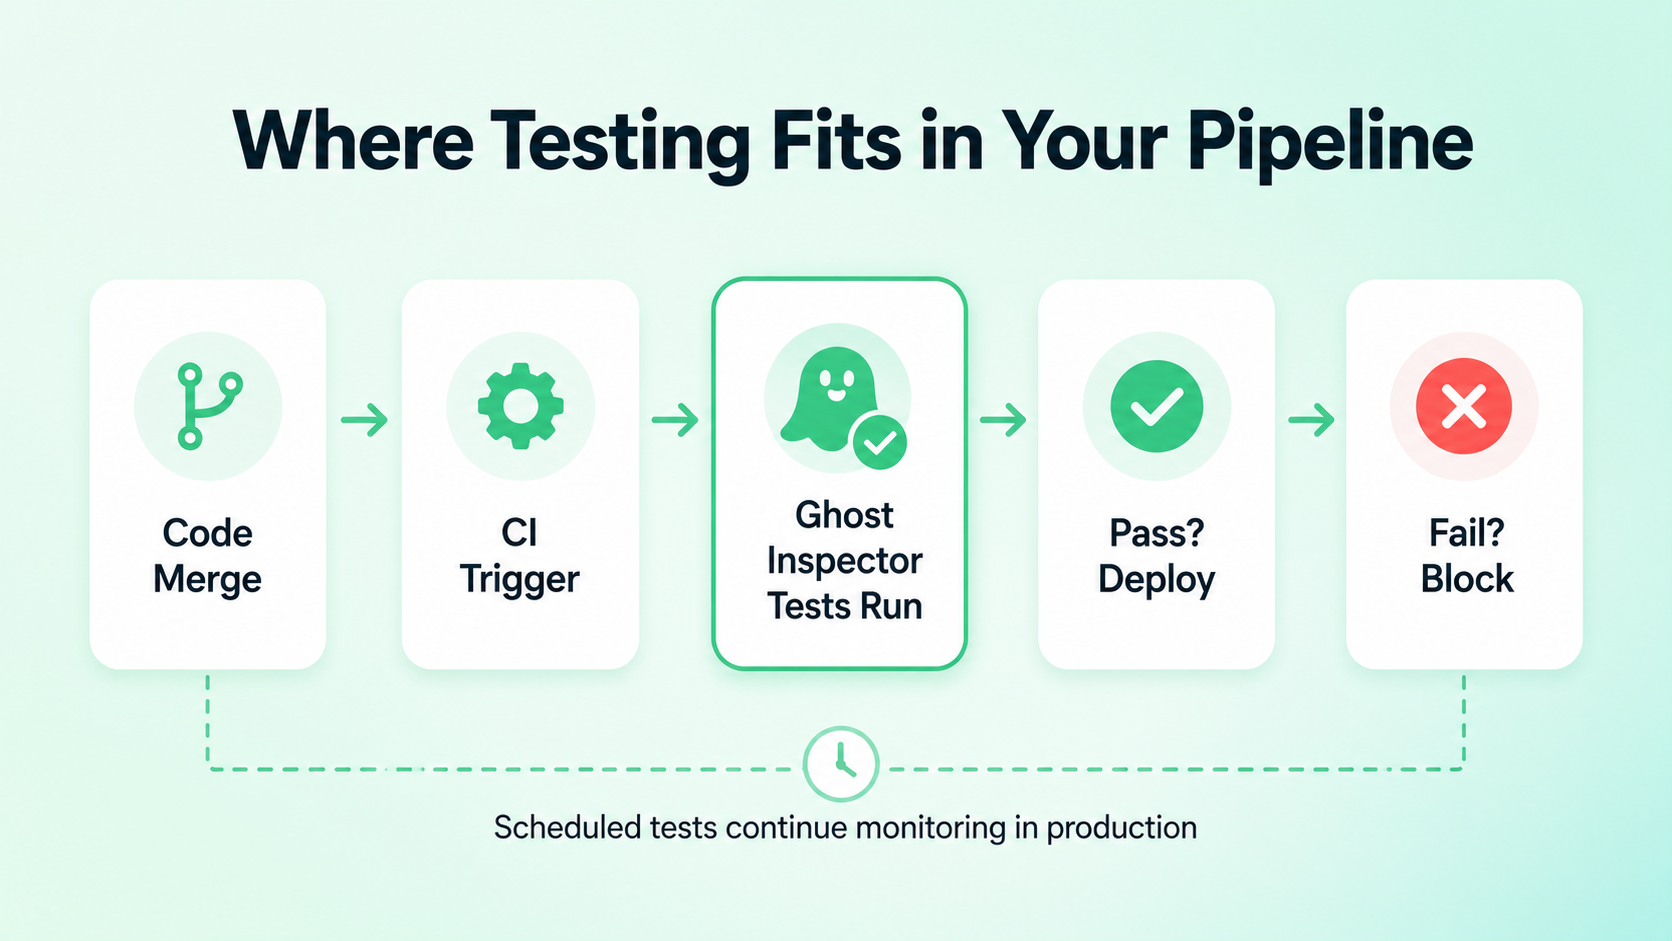
- Trigger tests automatically: set up your pipelines to kick off tests the moment code merges or a staging deployment completes.
- Gate your releases: if a critical flow test fails, block the deployment. Don’t let bad code get to production.
- Democratize the data: share dashboards and failure reports with developers, designers, and PMs so everyone can see the state of the app — not just QA.
- Combine testing strategies: use synthetic monitoring for pre-release validation and ongoing production coverage, then pair it with Real User Monitoring (RUM) for a complete picture.
Ghost Inspector integrates with all the popular CI/CD platforms — GitHub Actions, Jenkins, CircleCI, GitLab, and more. And because it’s all no-code, non-technical team members can build and contribute to tests too.
When testing is part of the pipeline and not an afterthought, you build a QA culture where protecting users becomes everyone’s job.
The role of AI: A co-pilot, not an autopilot
AI is everywhere in the software testing conversation right now, often pitched as a magic bullet that’ll write, run, and maintain your entire test suite. And look — AI is great for brainstorming edge cases, summarizing reports, or generating test data. But it doesn’t replace the need for deterministic, intentional monitoring.
When revenue is on the line, you don’t want a probabilistic model guessing whether your checkout works or a button is visible. You need certainty. AI doesn’t inherently know your business logic, and it can’t define what success looks like for your specific user journeys.
That’s why Ghost Inspector remains the cornerstone of effective QA. It gives you rock-solid, predictable execution — 100% control over your test steps, assertions, and visual baselines. You can use AI on the side to help shape your strategy or generate test data.
Best practices for long-term success
Here’s what to keep in mind as you scale:
Start with your 2–3 highest-impact flows (checkout, login) and expand from there. Keep your visual baselines fresh as your design evolves. Stack synthetic testing, visual regression, and instant alerts for full coverage — and track incident rates and MTTR to show the value of your QA efforts. Train cross-functional teams so QA isn’t just QA’s job, and review failure trends regularly to catch deeper architectural problems before they snowball.
Conclusion: Take control of your critical user flows today
Protecting your critical user flows isn’t optional — it’s how you deliver reliable digital experiences and keep your business growing. The seven strategies in this guide (from synthetic browser testing and visual regression to CI/CD integration and rich alerting) give you a solid framework to catch issues before your customers ever see them.
Ghost Inspector brings all of it together: codeless recording, automated browser testing, built-in visual regression, flexible scheduling, and seamless CI/CD integrations. Teams of all sizes use it to protect their most important flows — with minimal effort and a lot more confidence.
Don’t leave your user experience to chance.
Sign up for a free trial, install the recorder, capture your first test in minutes, and set up alerts. You’ll be monitoring your critical flows before the end of the day.