

Ghost Inspector vs Selenium IDE
To start, here’s a brief overview of some similarities and differences between Ghost Inspector and Selenium IDE.
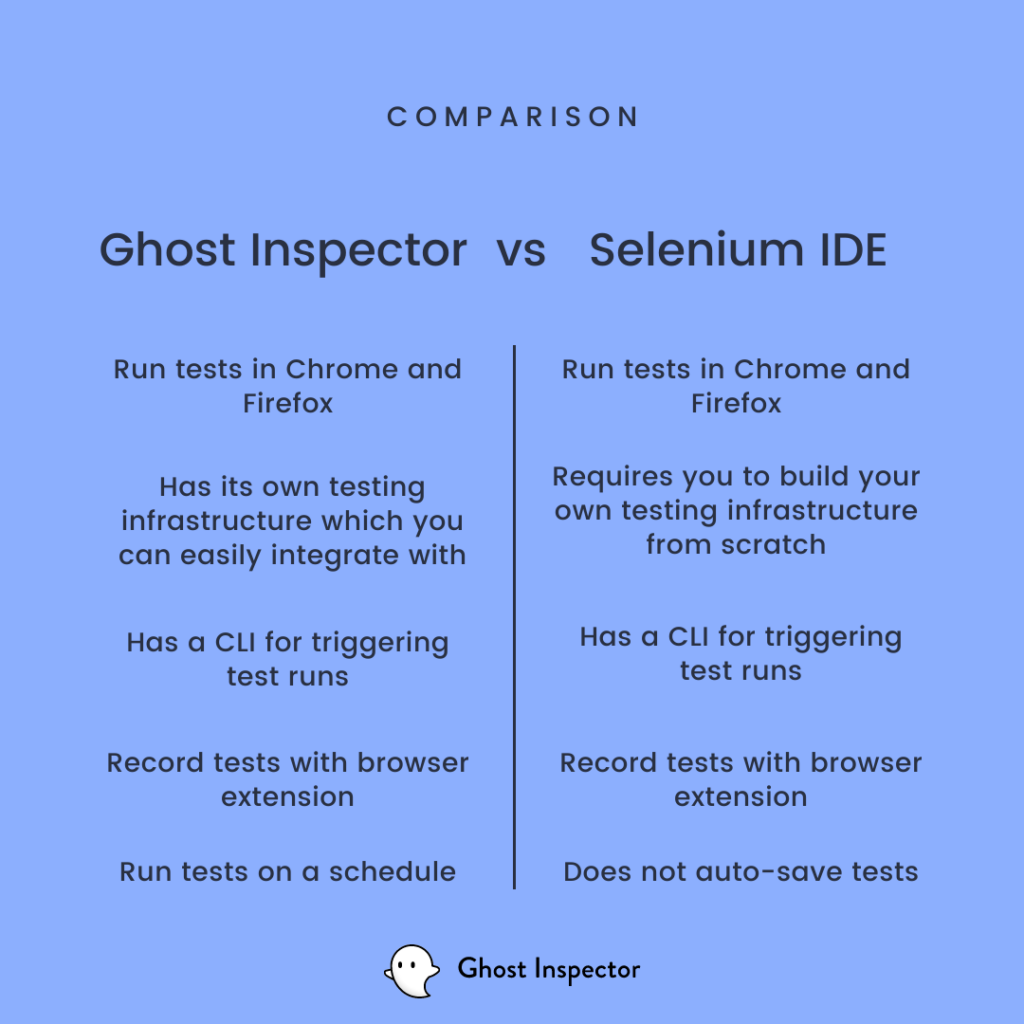
- Ghost Inspector can run tests in Chrome and Firefox
- Selenium IDE can additionally run tests in Safari and Edge
- Ghost Inspector can run tests on a schedule
- Both have extensions that can record tests in the browser
- Ghost Inspector has its own testing infrastructure which you can easily integrate with
- Selenium IDE requires you to build your own testing infrastructure from scratch
- Both have a CLI for triggering test runs
How to Use Selenium IDE
To record a test with Selenium IDE you’ll first need to install the browser extension in Chrome or Firefox.
When you start recording, any actions you take in the browser will be stored so they can be saved as a test and repeated in the future.
For example, if you were to start recording, load Google, search for “Ghost Inspector”, click the search button, and then assert that “Ghost Inspector” is somewhere on the page, you’d end up with a test that looks something like this.
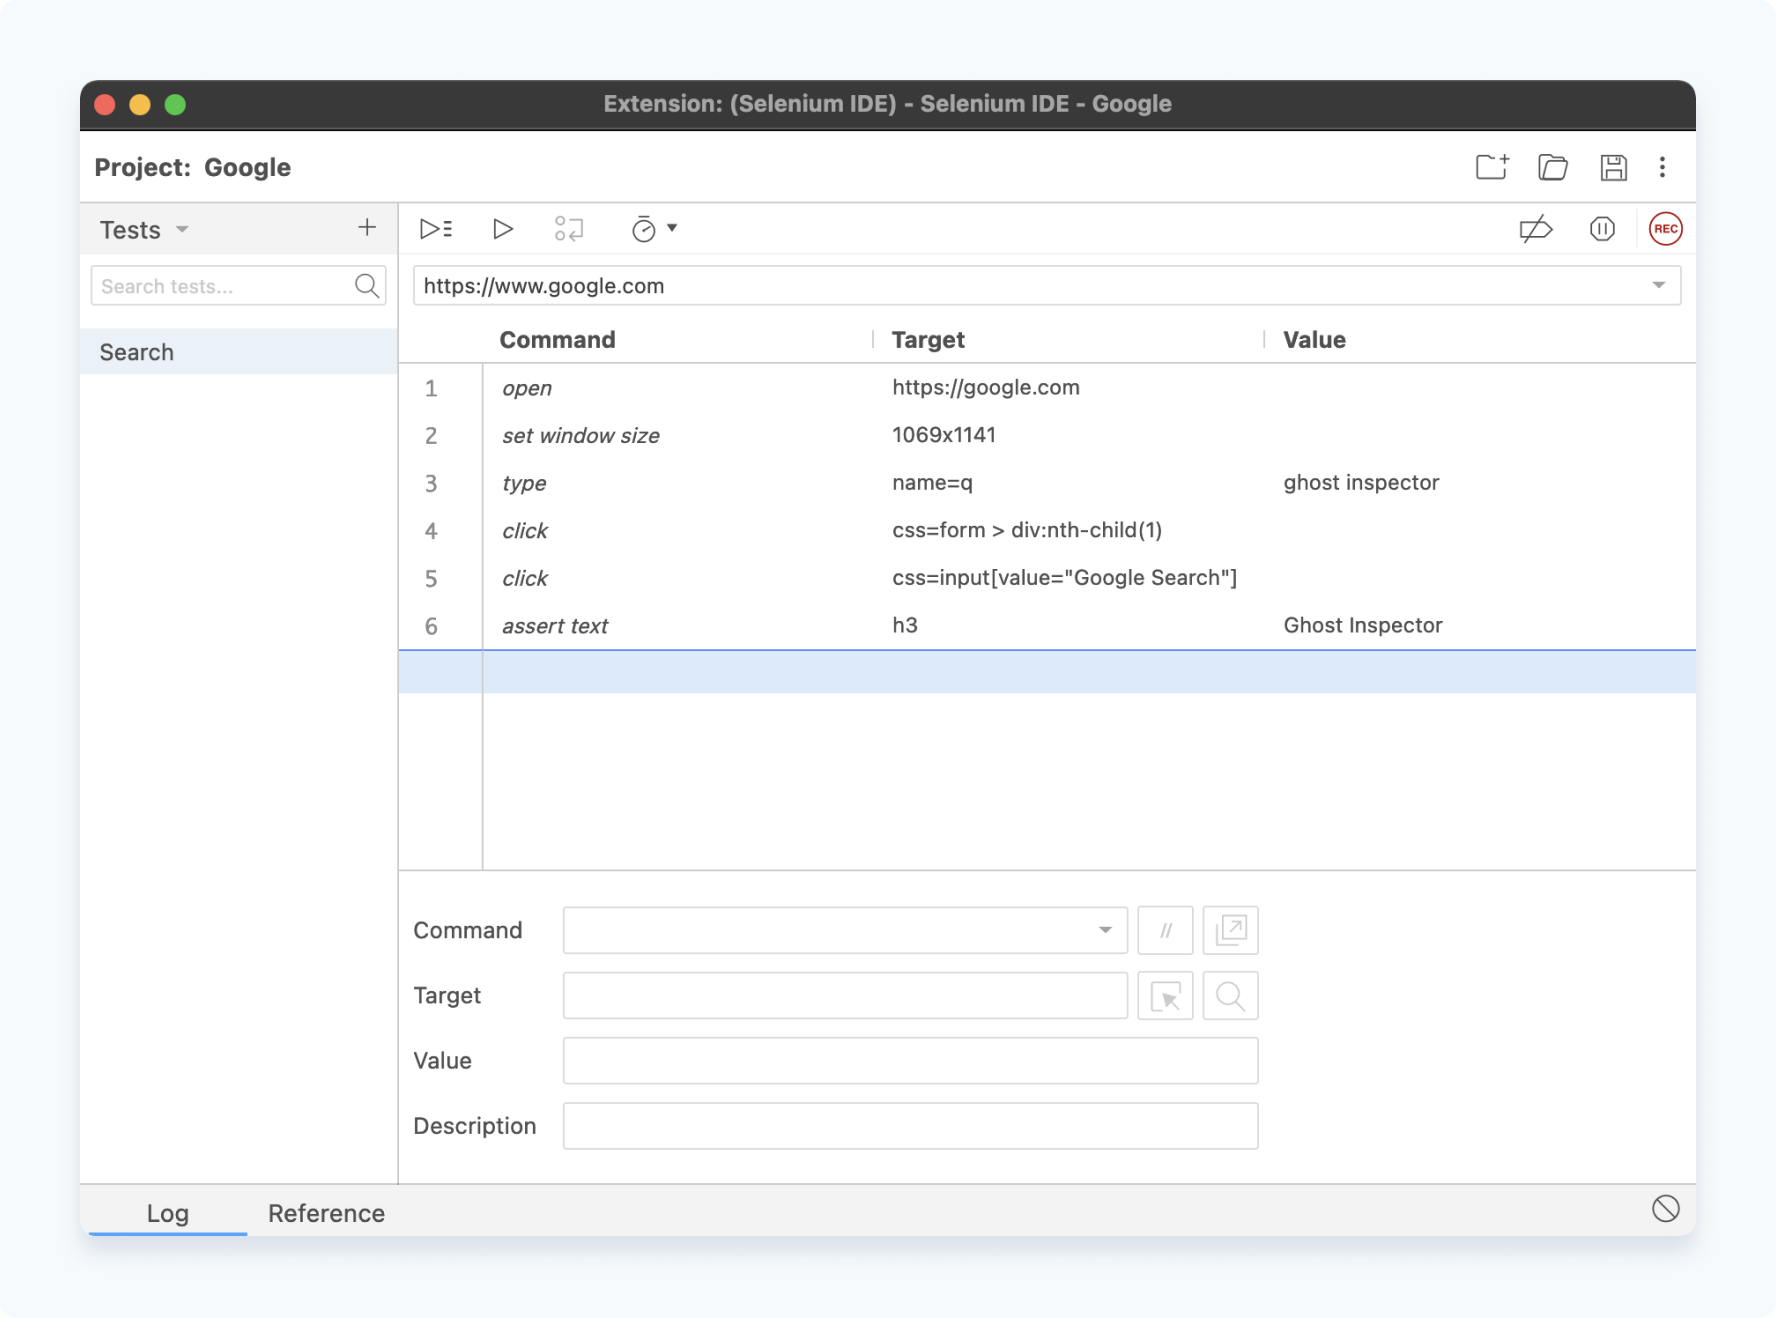
Selenium IDE groups multiple tests into “projects” which you can save as a .side file. It’s very important to save your project because Selenium IDE will not remember your project if you close your browser. If you haven’t saved it then you’ll have to recreate it.
Running tests within Selenium IDE
After you’ve created a test you can run it within Selenium IDE. You can run it over and over again to continually ensure that your website or application works properly.
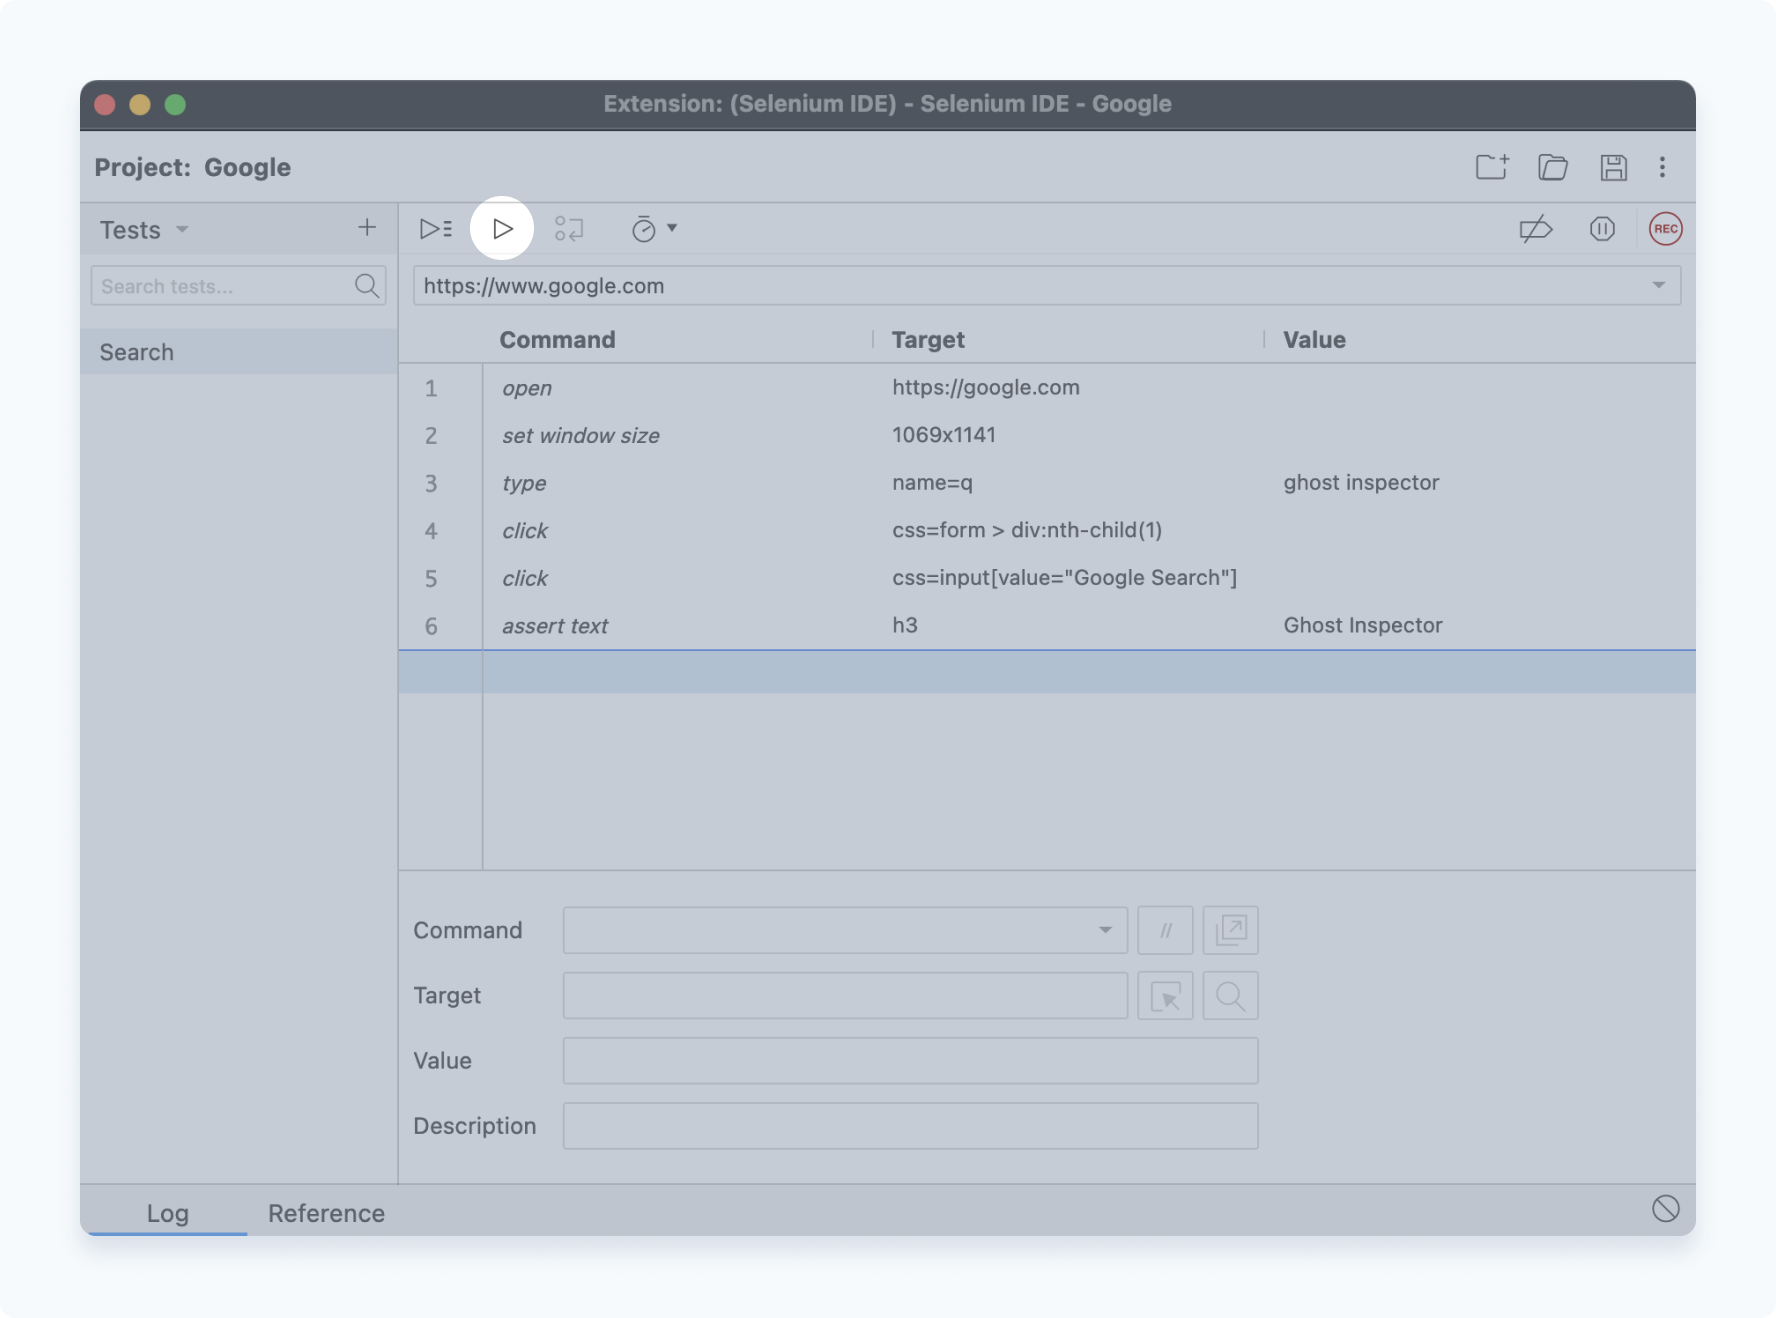
But repeatedly running tests this way can get a bit tedious. Every time you want to run a test you’ll need to open your browser, open Selenium IDE, find and load the appropriate .side file, and then run it.
Selenium IDE can also only load one project file at a time, so if you have multiple groups of tests you’ll have to switch files every time you want to run a test that’s in a different project.
A much better way to run Selenium IDE tests is with the Selenium command-line runner. It requires a bit of a setup but afterwards you can run tests with one command.
$ selenium-side-runner ./project-name.side
The command-line runner will automatically open a browser and run your tests, without having to first load them into Selenium IDE. This makes it possible to run your tests against browsers that Selenium IDE doesn’t have a browser extension for, like Safari and Edge.
The runner also makes it possible to set up some testing infrastructure to run your tests automatically instead of doing it manually. You could put your Selenium IDE project file into your code repository and build a system where after you deploy you use the command-line runner to run your tests and ensure everything still works.
But building these systems can be difficult and requires a lot of investment upfront, so you can save a lot of time and effort by using a hosted service like Ghost Inspector.
How to import Selenium IDE tests into Ghost Inspector
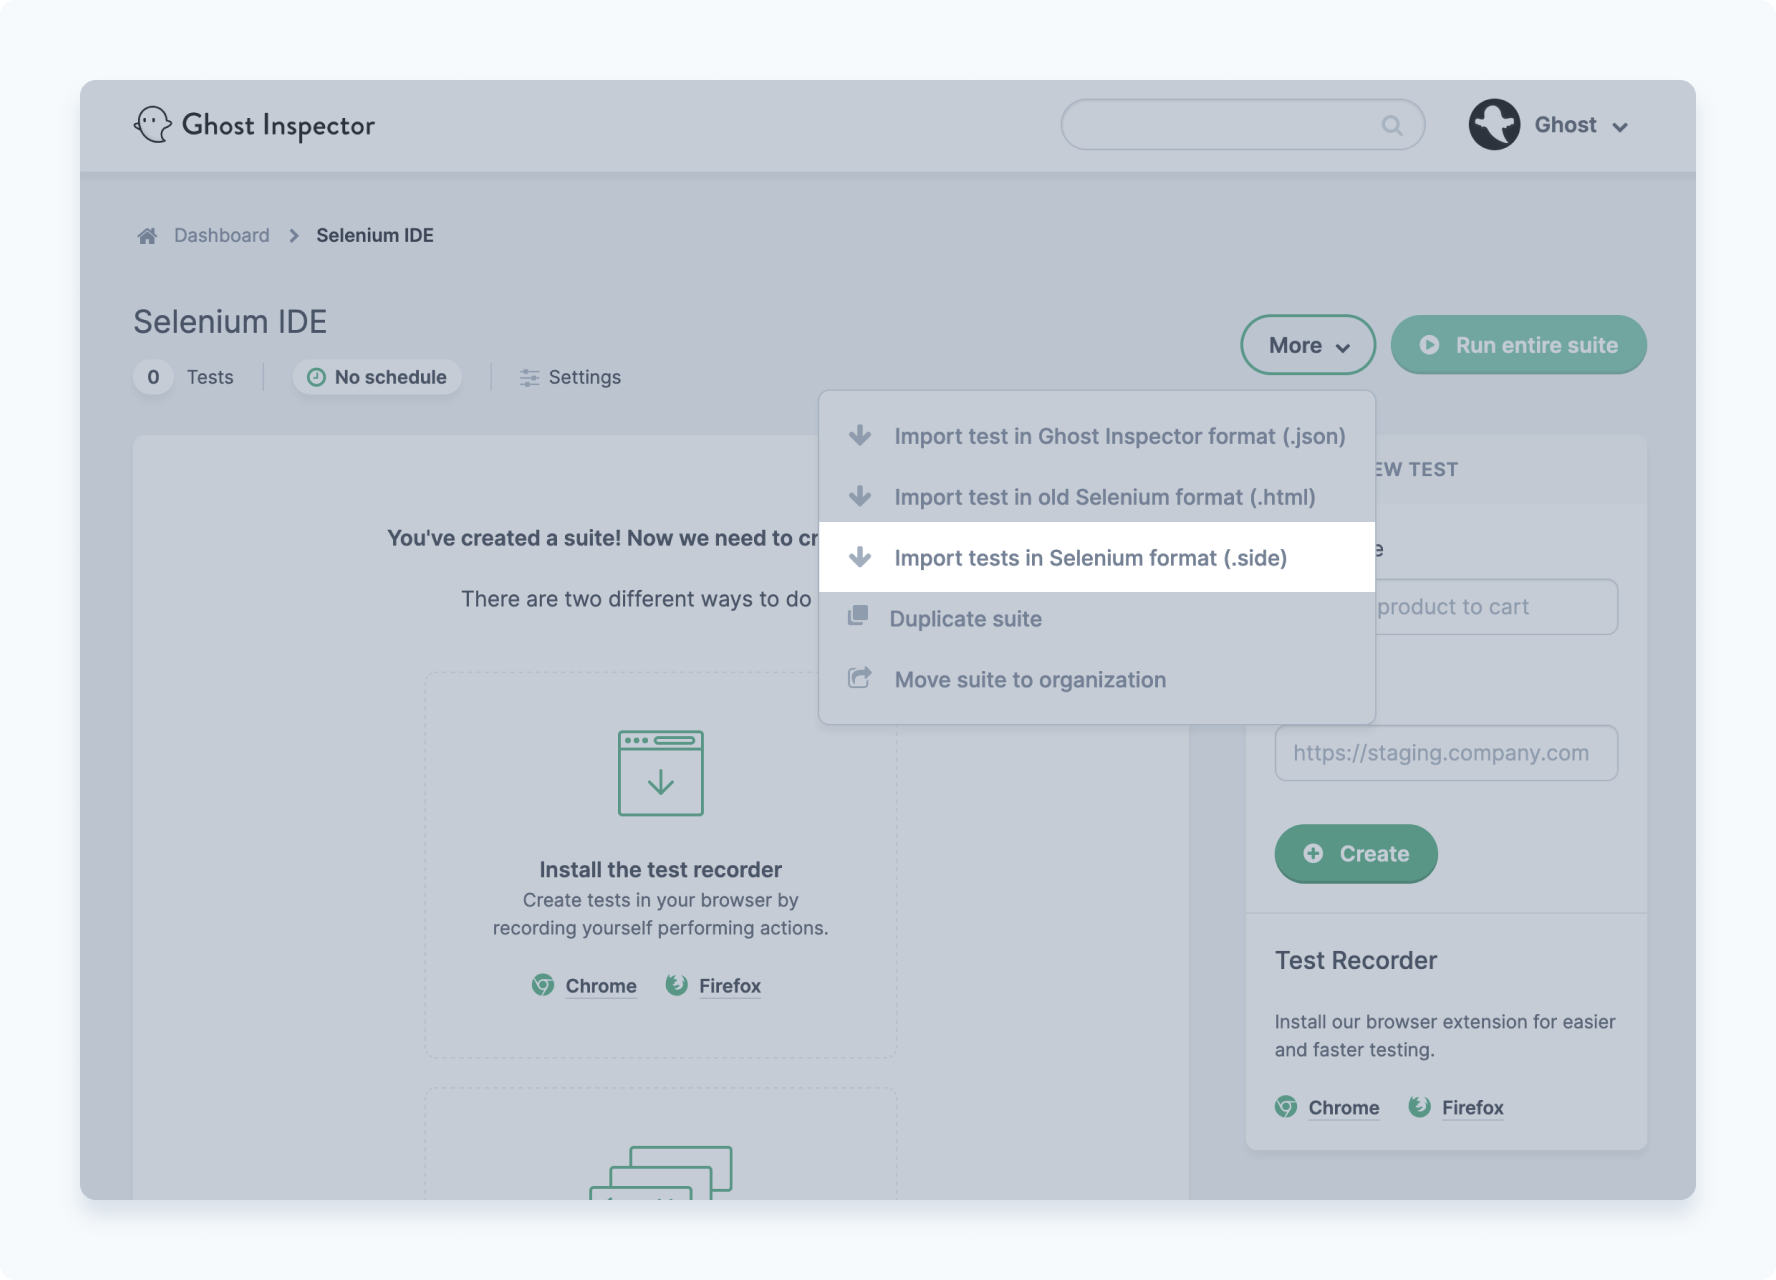
If you already have some Selenium IDE tests and you want to use Ghost Inspector you can easily import your project files.
We call groups of tests “suites”, so first create one to house your Selenium IDE project, then you can import all the tests from it into that suite.
Instead of juggling multiple Selenium IDE projects and trying to keep them in sync when sharing them among teammates, with Ghost Inspector they’re all in one canonical place and everyone has access to the most up-to-date version.
Running tests within Ghost Inspector
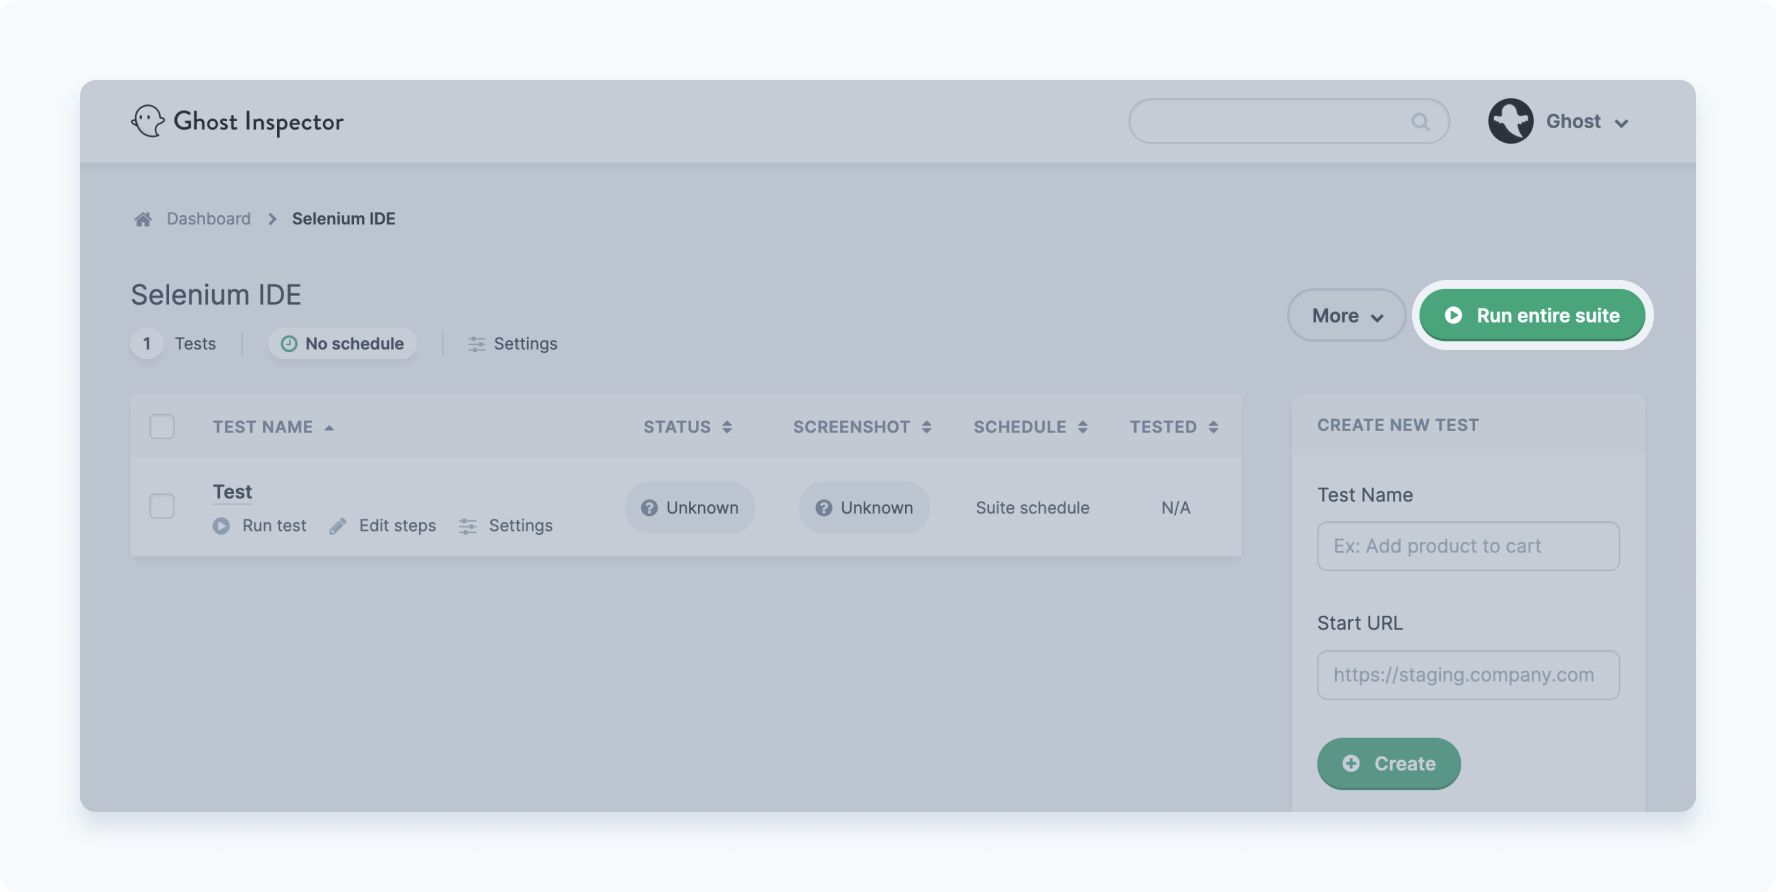
Running tests in Ghost Inspector is similar to Selenium IDE, but everything is always saved so you don’t need to load any save files or switch between save files. You can easily navigate between suites and tests, and to run one you just click “Run”.
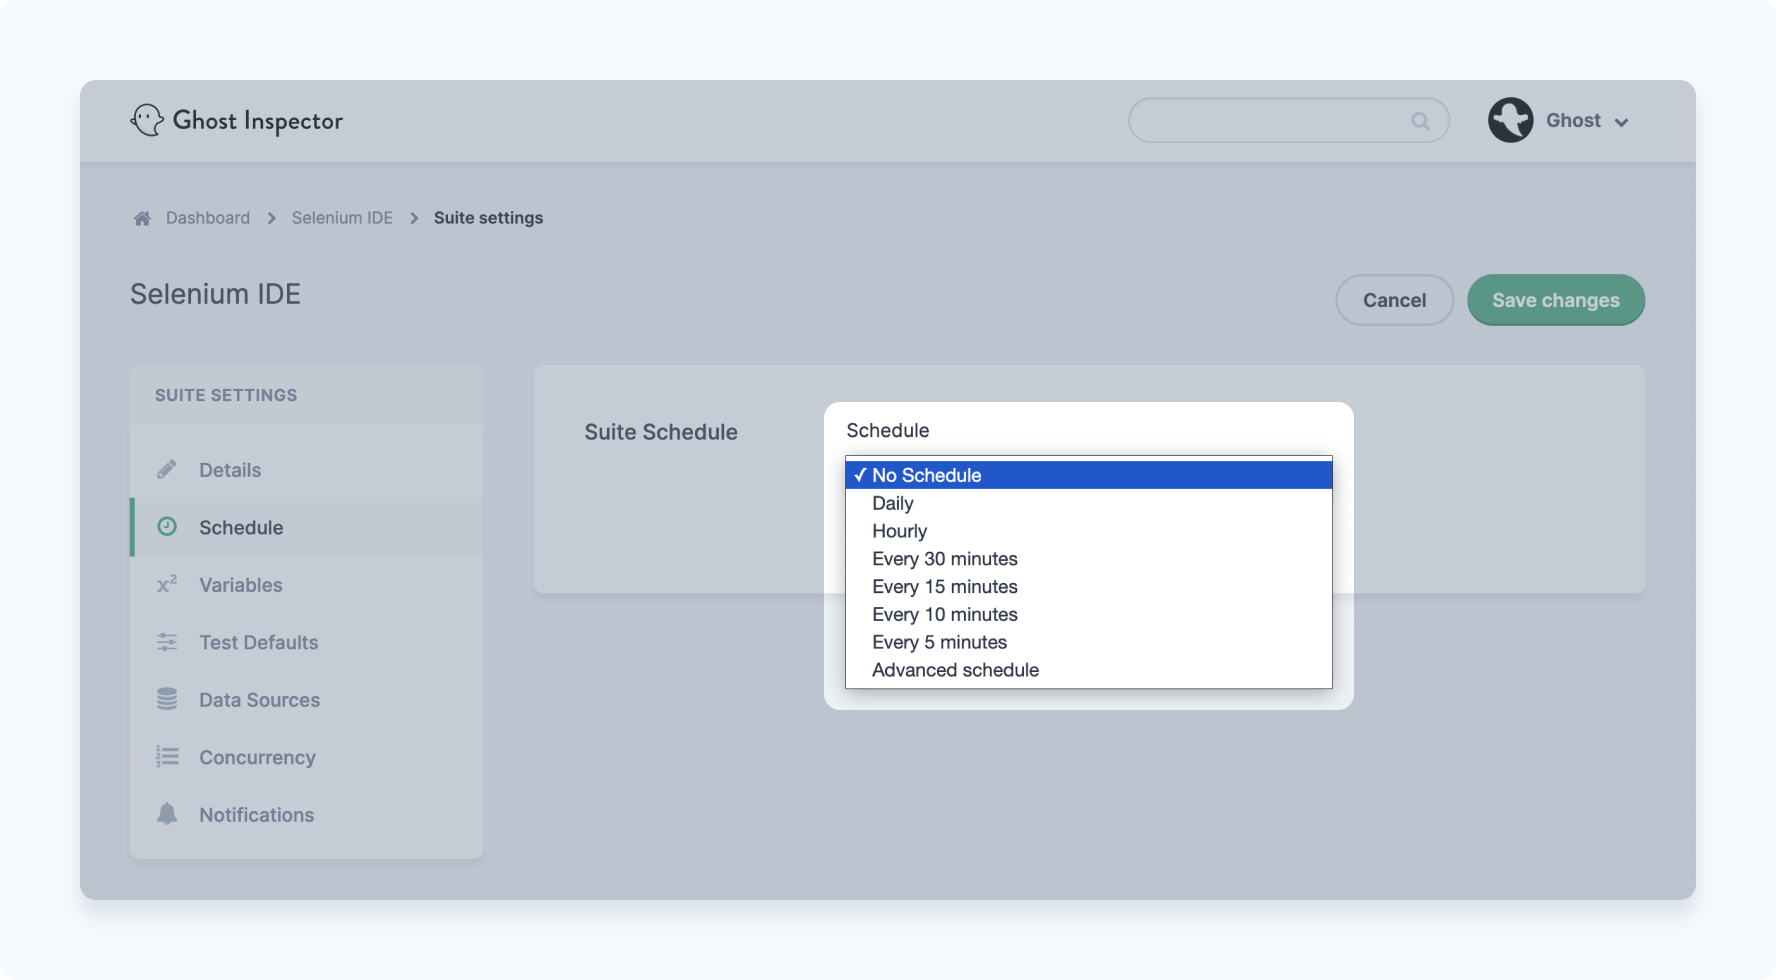
In addition to manually running tests, you can also set tests to run on a schedule. This is a great way to run tests without having to modify your deployment setup. Just automatically run the tests every 5 minutes and you’ll always know if a deploy broke something.
The last way to run tests in Ghost Inspector is with our command-line interface.
$ ghost-inspector test execute {{my-test-id}}
If you’re already running tests when you deploy it’s easy to use the command-line runner to trigger Ghost Inspector tests.
Additionally there are a bunch of other benefits to running tests in Ghost Inspector, like having a result history that everyone can see, being able to take screenshots to verify visual changes, getting proactive notifications when tests fail, and a lot more.
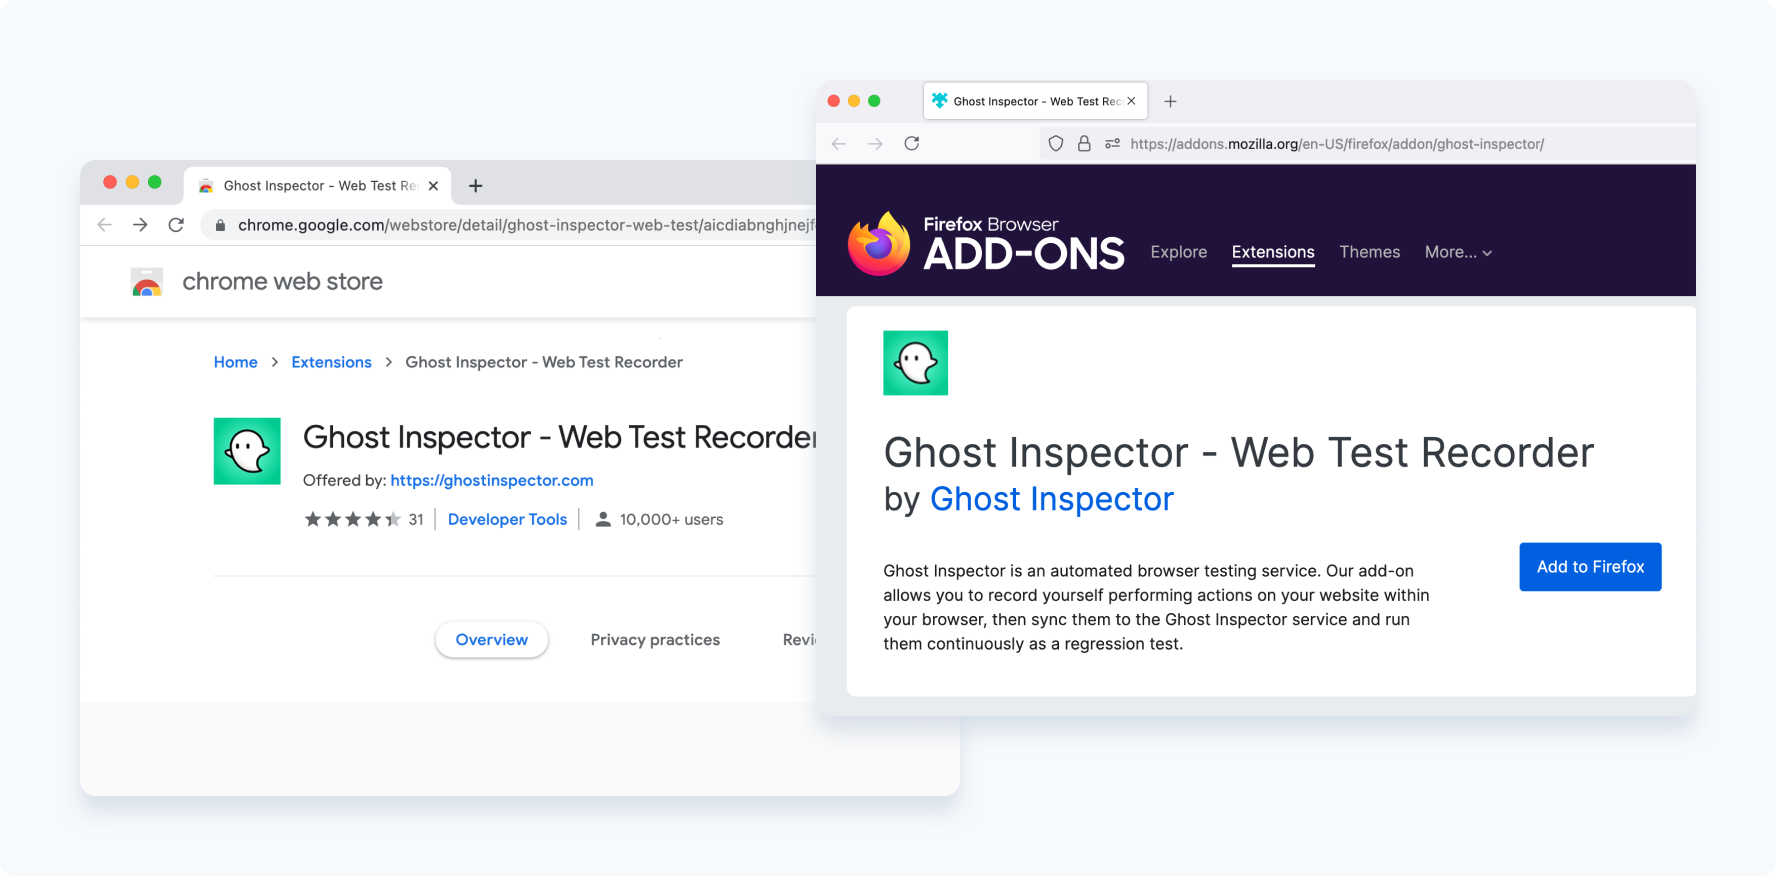
Ghost Inspector browser extension
If you like using Ghost Inspector to run your tests, we also have our own browser extension for Chrome and Firefox. You can use it to record tests and save them directly to Ghost Inspector and skip the extra step of creating them with Selenium IDE and importing them.
Exporting Ghost Inspector tests to Selenium IDE
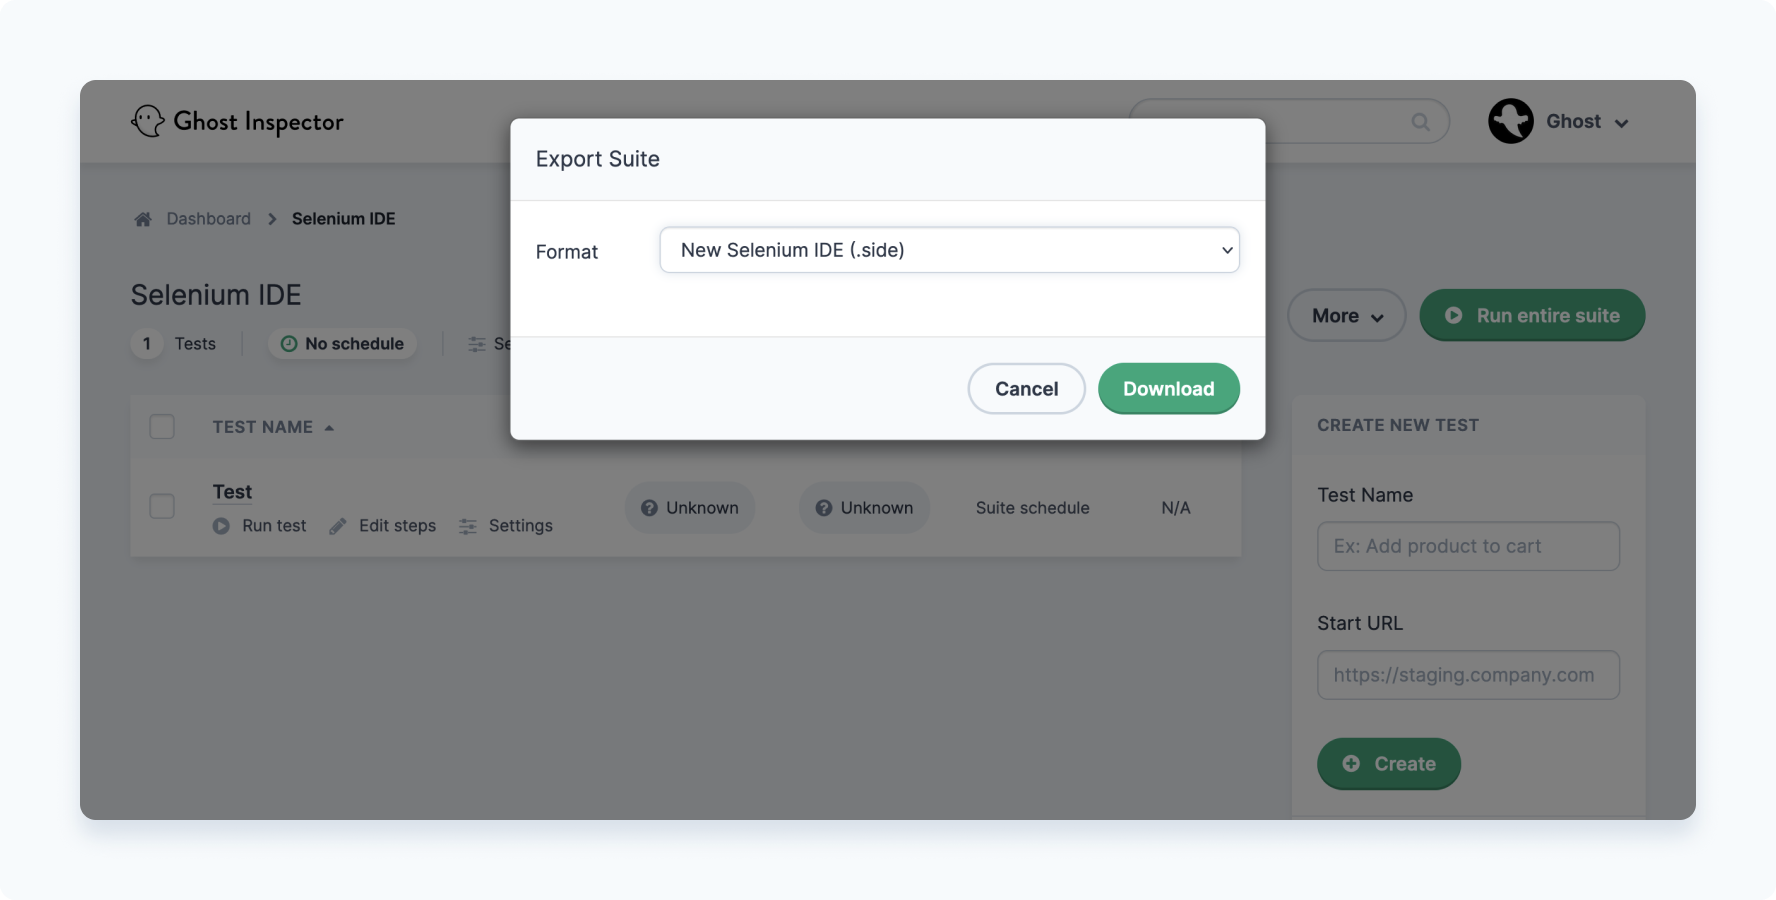
Ghost Inspector has the ability to export tests into Selenium IDE’s .side file format. This means that you can store your tests in Ghost Inspector, but export them at any time to run them locally using the Selenium IDE plugin or runner. This can be helpful if you’d like to walk through your tests on your own machine or use a browser such as Safari, Internet Explorer, or Microsoft Edge.
Better together
Ghost Inspector supports both importing and exporting Selenium IDE’s .side file format which allows you to use the tool along with our service. You can create your tests with our recording extension and export them to Selenium IDE for running, or create them in Selenium IDE and import them to run in Ghost Inspector. While storing and running your tests in Ghost Inspector offers some distinct advantages, Selenium IDE can be a really useful compliment for working with browser tests in your local environment.
Selenium IDE vs Ghost Inspector FAQ
What is Selenium IDE?
Selenium IDE is an open-source tool for recording and running automated browser tests. It allows you to interact with a browser and record your actions as a test case.
What is Ghost Inspector?
Ghost Inspector is a cloud-based automated testing platform that allows you to create and run automated tests for your web applications.
How can I use Selenium IDE with Ghost Inspector?
To use Selenium IDE with Ghost Inspector, you can export tests from Selenium IDE in .side file format and import them into Ghost Inspector. Ghost Inspector also allows you to import single tests in Selenium HTML format from the suite screen
What is the file format used by Ghost Inspector for exporting tests to Selenium IDE?
How do I export my tests from Ghost Inspector in the Selenium IDE .side file format?
To export your tests from Ghost Inspector in the Selenium IDE .side file format, go to the “Tests” page in Ghost Inspector, select the tests you want to export, click the “Export” button, and choose “Selenium IDE” as the export format.
Can you export tests from Ghost Inspector in a format other than Selenium IDE’s .side file format?
Does Ghost Inspector support data-driven testing with Selenium?
Yes, Ghost Inspector supports data-driven testing with Selenium. This allows you to supply a set of inputs and expected outputs for a test case.
You can read more about importing and exporting in our docs or sign up for a free trial to get started with Ghost Inspector.